Introduction
The Rally Base Drop SND Pivots indicator by LuxAlgo is a sophisticated tool created to assist traders in recognizing pivot points based on the “Rally,” “Base,” and “Drop” candle patterns. The approach offers a logical and orderly method of labeling supply and demand (SND) levels, removing excessive noise and enhancing market analysis.
Hi, so in this article we’re going to break down the working process, application, parameters, and advantages of the Rally Base Drop SND Pivots indicator. And we’ll also talk about how this tool works together with different trading strategies, like Forex trading, futures trading, scalping, and day trading.
What is the Rally Base Drop (RBD) Concept?
The RBD SND Pivots indicator is based on a systematic approach to determining the pivot zones where the market momentum reverses. The pivots are formed when a sequence of candles meets the below conditions:
– A “Rally” is a sequence of bullish candles (green), showing a strong upward trend.
– A “Drop” is a sequence of bearish candles (red), indicating a strong downtrend.
A “Base” happens in that difficult time when a rally turns into a drop, pinpointing a possible reversal zone.
As opposed to those old-school fractal-based pivot indicators, the RBD SND Pivots tool requires one side of the pivot to be exclusively green candles and the other side to be exclusively red candles, which ensures you receive a clean and organized pivot setup.

How Does the RBD SND Pivots Indicator Work?
The RBD SND Pivots indicator detects exact pivot points from candles which rally then fall one after another. These levels are key supply and demand zones, which help traders to:
– Determine the principal market structure levels.
– Reduce market noise with a systematic approach to pivots.
– Improve your trading decisions by integrating pivot analysis with other indicators like moving averages, Fibonacci retracement, and RSI.
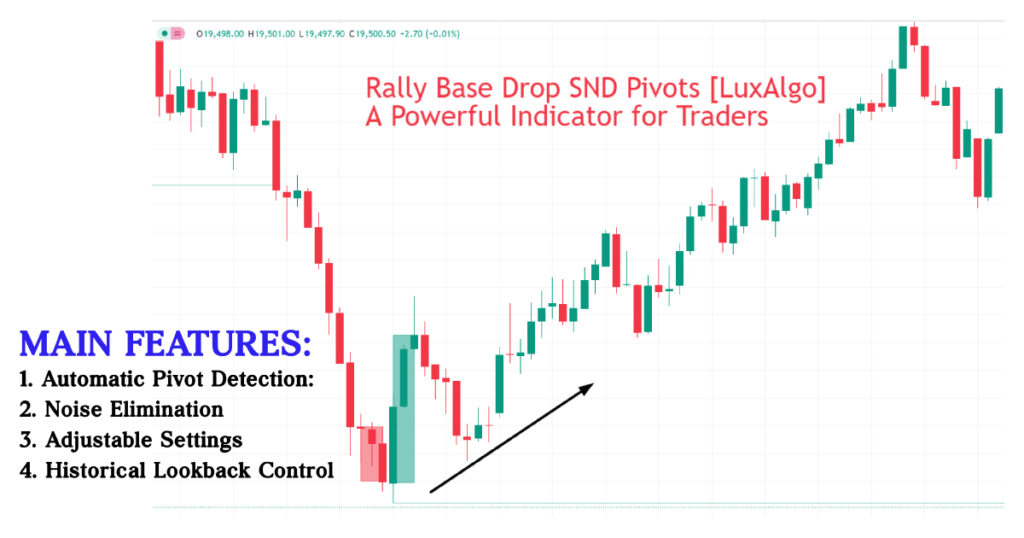
Main Features:
1. Automatic Pivot Detection: The indicator highlights those pivot points where the ups and downs meet head-on.
2. Noise Elimination: Using a systematic and logical approach, this indicator effectively removes false signals..
3. Adjustable Settings: You may adjust the number of rally/drop candles you require for determining those pivot points.
4. Historical Lookback Control: Permits concealment of historical levels for tidier chart analysis.
Key Features:
1. Length
– It calculates the number of Rally and Drop candles you will require to form a pivot.
– Example: A length of 3 means the system looks for 3 consecutive green candles followed by 3 consecutive red candles (or the other way around) to identify a pivot.
2. Historical Lookback
– It specifies how many previous pivot levels are displayed on the chart.
– Setting this to 0 displays all levels, and a larger number minimizes clutter.
3. Color Settings
– Rally Color: Green (customizable)
– Drop Color: Red (customizable)
– They help to visually distinguish pivots on the chart.
Applications in Real-Life Trading
1. Forex Trading & Scalping Futures
– The indicator helps Forex traders identify strong support and resistance levels.
– It performs best in scalping futures of products like E-mini Dow, S&P 500 Mini Futures, and NASDAQ QQQ.
2. Day Trading & Swing Trading
– Day traders use RBD SND pivots as reference points for setting stop losses and profit objectives.
– Swing traders can use these levels to know where to enter and exit markets like NVDA trading, SPX Futures, and MetaTrader 4 & 5.
3. Stocks & Crypto Trading
– This metric is quite useful for examining stocks such as Tesla (NASDAQ TSLA), Amazon (NASDAQ AMZN), and Google’s share price action.
– Cryptocurrency traders can use this for finding potential breakout zones of assets on WeBull, Robinhood, and Binance.
Using the RBD SND Pivots Indicator like a Pro
1. Combine it with Other Indicators
For best results, traders can use RBD SND Pivots with:
– Average True Range (ATR) – For measuring market volatility.
– RSI Indicator & MACD Indicator – For confirming momentum changes.
– Bollinger Bands – To identify overbought/oversold levels.
2. Set Realistic Targets & Stop-Losses
– Use the high/low of the base candles as entry/exit levels. – Place your stop-losses slightly below support levels or above resistance areas. 3. Focus on Key Market Sessions – This is most effective during high-liquidity periods, such as the opening of the New York Stock Exchange (NYSE), the London Forex session, or pre-market trading. Conclusion The Rally Base Drop SND Pivots [LuxAlgo] indicator is an excellent tool for traders looking to add structure and precision to their trading approach.
With its strict logic-based pivot detection, traders can reduce noise and identify high-probability trading zones in Forex, stock markets, and futures trading. If you are effectively managing your risks and have a solid trading plan, this indicator can be a game-changer for both scalping and longer-term trading strategies. Whether you trade E-mini S&P 500 Futures, Dow Jones Industrial Futures, or Forex pairs like EUR/USD, incorporating RBD SND Pivots can significantly improve your trading decisions. Discover More Trading Instruments Looking for more sophisticated trading indicators? Use TradingView, NinjaTraders, and MetaTrader 5 for additional analysis tools to enhance your trading experience.
To know more about Forex Trading for Beginners click HERE


Pingback: Forward-Backward Exponential Oscillator by LuxAlgo
Hi my loved one! I want to say that this article is awesome, great written and come with approximately all vital infos. I would like to peer more posts like this .
I love your blog.. very nice colors & theme. Did you create this website yourself? Plz reply back as I’m looking to create my own blog and would like to know wheere u got this from. thanks
It’s in point of fact a great and useful piece of information. I am satisfied that you simply shared this useful information with us. Please stay us informed like this. Thanks for sharing.
I like this post, enjoyed this one regards for putting up. “What is a thousand years Time is short for one who thinks, endless for one who yearns.” by Alain.
you have a great blog here! would you like to make some invite posts on my blog?
Usually I don’t read article on blogs, but I would like to say that this write-up very forced me to try and do it! Your writing style has been amazed me. Thanks, quite nice article.
I used to be more than happy to search out this internet-site.I wished to thanks for your time for this wonderful read!! I definitely having fun with each little bit of it and I have you bookmarked to check out new stuff you blog post.
Thanks a lot for sharing this with all people you really recognize what you are speaking approximately! Bookmarked. Please additionally consult with my web site =). We may have a hyperlink change contract between us!
Does your blog have a contact page? I’m having trouble locating it but, I’d like to shoot you an e-mail. I’ve got some ideas for your blog you might be interested in hearing. Either way, great website and I look forward to seeing it improve over time.
Hello my friend! I want to say that this article is awesome, nice written and come with almost all significant infos. I would like to see extra posts like this .
Somebody essentially lend a hand to make severely posts I would state. This is the very first time I frequented your website page and so far? I amazed with the analysis you made to make this particular submit amazing. Magnificent task!
I don’t think the title of your article matches the content lol. Just kidding, mainly because I had some doubts after reading the article.
Usually I do not read article on blogs, but I would like to say that this write-up very forced me to try and do so! Your writing style has been amazed me. Thanks, quite nice article.
Thanks for sharing. I read many of your blog posts, cool, your blog is very good.