Today, there are plenty of competitors in trading, so tools such as Fibonacci retracements are extremely significant in helping out stock and forex day traders. If you want to advance your game in intraday trading, having a handle on using those Fibonacci levels accurately can actually make a pretty significant difference.
So, this tutorial’ll teach you how to utilize Fibonacci retracement to trade forex and equities like a boss in 2025. I have also included some awesome tips on how you can set it up on TradingView and incorporate it into your strategies.
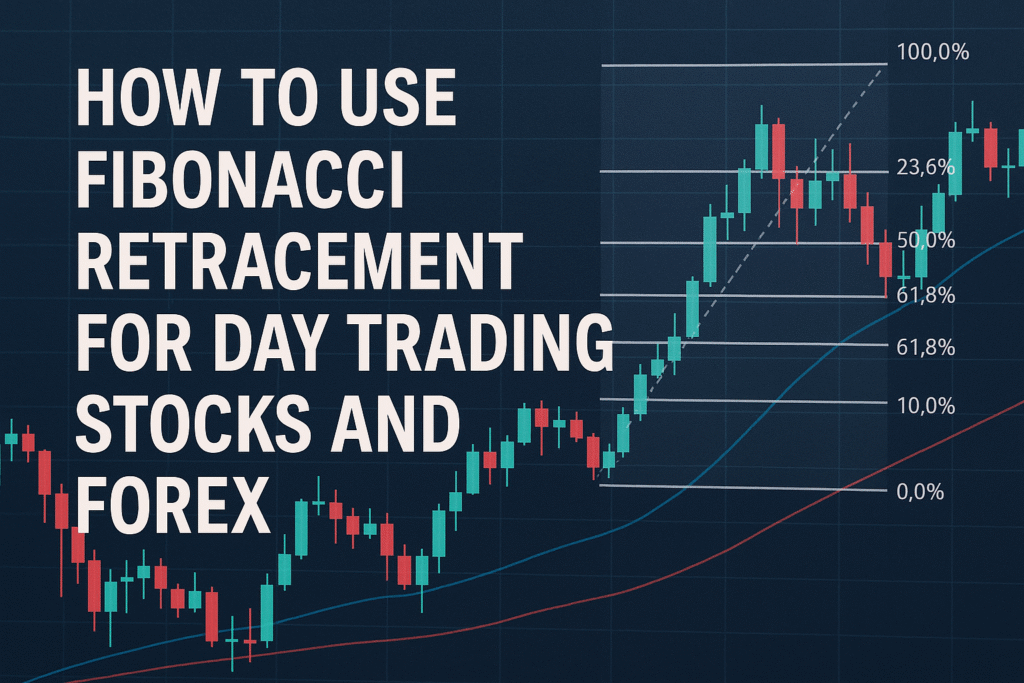
What is Fibonacci Retracement?
Fibonacci retracement is a neat trading analysis tool based on some significant figures from a mathematician called Leonardo Fibonacci. In trading, essentially, we’re talking about the likelihood that a price pulls back by a proportionate amount after moving, then it may continue in its original direction.
The common Fibonacci levels of retracements are:
- 23.6%
- 38.
- 50% (not technically a Fibonacci number, but widely used)
- 61.8%
- 78.6%
These levels are similar to areas where price may cool down a little, reverse directions, or continue moving along its trend.
Day traders absolutely utilize Fibonacci retracement to get into trades at superior prices, place stop losses, and lock in profit targets a lot more precisely.
Why Fibonacci Retracement Works for Day Trading
- Psychological importance: Many traders worldwide watch these levels, making them self-fulfilling.
- Structured trading: Helps you build systematic entry/exit rules instead of guessing.
- Works across markets: Fibonacci behaves consistently when you’re trading Tesla stock (TSLA) or the EUR/USD forex pair.
- Enhances price action trading: Complements candlestick patterns and trend analysis nicely.
- With the quick pace of day trading, the ability to read and react to Fibonacci levels provides a true edge over traders who merely trade on gut feel.
Setting Up Fibonacci Retracement on TradingView
It’s really simple to use the tools from Fibonacci on TradingView. I’ll demonstrate how!
- Get a chart of the stock or forex pair you want to trade.
- Pull up the Fibonacci Retracement tool from the left side toolbar.
- Click on the swing low (for an uptrend) or swing high (for a downtrend).
- Drag to the recent swing high or swing low.
Great! Now you’ll notice those horizontal lines that correspond to the major Fibonacci levels.
Quick tip: modify your Fibonacci settings to include 78.6% and 88.6% retracements—those levels can really produce some powerful reversals, particularly when trading forex.
Explore our newest tools designed to enhance your Forex trading experience effortlessly Check HERE
How to Trade Stocks Using Fibonacci Retracement
Okay, so first off, let’s talk about stocks, where day traders actually focus on Fibonacci retracement levels:
1. Identifying the Trend
First, get a sense of the overall picture before delving into Fibonacci.
- Uptrend: Draw Fib retracement from swing low to swing high.
- Downtrend: Simply draw the Fib retracement from swing high to swing low.
Never apply Fibonacci against the primary trend unless you’re intentionally trading a countertrend setup (higher risk).
2. Jumping into Trades at Key Pullback Levels
Once plotted, look for the price to pull back to these Fibonacci levels:
- 38.2% retracement: Indicates a strong trend; minor pullback.
- 50% retracement: Deeper pullback; many institutional traders look here.
- 61.8% retracement: Golden ratio; powerful reversal point.
Example in stocks:
Okay, so you’ve got Apple (AAPL) trending upwards, then backtracking to its 50% Fib level, and then you have a bullish engulfing candle on a 5-minute chart, which is a strong buy signal.
3. Establishing Stop Losses and Target Profit
- Stop Loss: Place slightly below the next Fibonacci level after your entry (e.g., entry at 50%, stop below 61.8%).
- Take Profit: You can target the final swing high or try those extensions, such as the 127.2% and 161.8% Fibonacci levels, to achieve larger profits.
This ensures your risk/reward proportion remains on your side.
How to Trade Forex Using Fibonacci Retracement
Forex trading apparently suits Fibonacci levels of retracement well, given all that wild liquidity and all those automated trading arrangements.
1. Look at what’s happening on the longer timeframes:
First, observe the overall picture on either your 4-hour or 1-hour chart before analyzing your 5-minute or 15-minute charts to determine where you will enter.
Example:
If GBP/USD is rising on the 4-hour chart, watch for opportunities to go long, provided that it corrects back to those Fib levels throughout the day.
2. Combining Fibonacci with price action
Fibonacci works best when combined with:
- Identify pin bars at significant areas
- Bullish/bearish engulfing patterns
- Retest breakouts of levels near those Fibonacci levels
If EUR/USD reverts back to a 61.8% level of retracement and forms a bullish pin candle on a 15-minute chart, that’s a lovely set-up to go long on it.
3. Using Fibonacci Extensions for Targets
Many forex traders make use of Fibonacci extension levels to determine where to take profit after the recent swing high or low.
- 127.2 percent
- 161.8 percent
These levels are ideal to take profits, particularly on days when price action moves strongly.
Sample Fibonacci Day Trading Strategy
Here’s a very simple yet effective Fibonacci retracement trading system you can experiment with:
- Watch out for those large price movements (up or down) when the market opens.
- Plot Fibonacci retracement from swing low to swing high (uptrend) or high to low (downtrend).
- Wait until the price falls back down to the levels of 38.2%, 50%, or 61.8%.
- Scan for a bullish or bearish candlestick pattern in a retracement zone.
- Enter the trade, set the stop loss beyond the next Fib level.
- Target the previous swing high/low or Fibonacci extension.
It eliminates a lot of guesswork when you trade during the day.
Tips for Mastering Fibonacci Retracement Trading
- Combine with trendlines and moving averages: For added confluence.
- Don’t just jump in: Wait for price action confirmation at those Fib levels.
- Monitor news material: Insane news can push prices beyond those Fib levels temporarily.
- Make your charts tidy: Don’t overcrowd them with multiple tools—keep to 1-2 strategies.
- Backtest extensively: TradingView’s bar replay feature is excellent for practicing past Fibonacci setups.
Common errors to avoid
- Testing Fibonacci using weak moves: It works better following strong, impulsive moves, as opposed to horizontal chopping.
- Ignoring higher timeframe trends: Always align your trades with the dominant market direction.
- Stop simply jumping in when a price reaches a Fibonacci level—await a candlestick or volume signal first before taking action.
- Don’t place your stops too close: Leave room in your trades past those Fibonacci levels.
You need patience and discipline when trading with Fibonacci in live markets.
Conclusion:
Fibonacci in stocks and forex. With faster algorithms and smarter traders who understand their stuff, such as Fibonacci retracement, you’ll be in a very good position. Whether you’re day trading Tesla stock, Amazon shares, or scalping EUR/USD on the 5-minute chart, Fibonacci levels can guide your entries, stops, and targets with remarkable accuracy. And when you combine price action methods with effective risk management, Fibonacci retracement remains a fundamental aspect of shrewd day trading methods. If you actually want to level up your trading, try using Fibonacci setups on TradingView every single day—it might be what distinguishes you from making trades at random and being a consistently profitable trader.


Pingback: Day Trading vs Swing Trading Strategy Works Best on TradingView - Trading Views