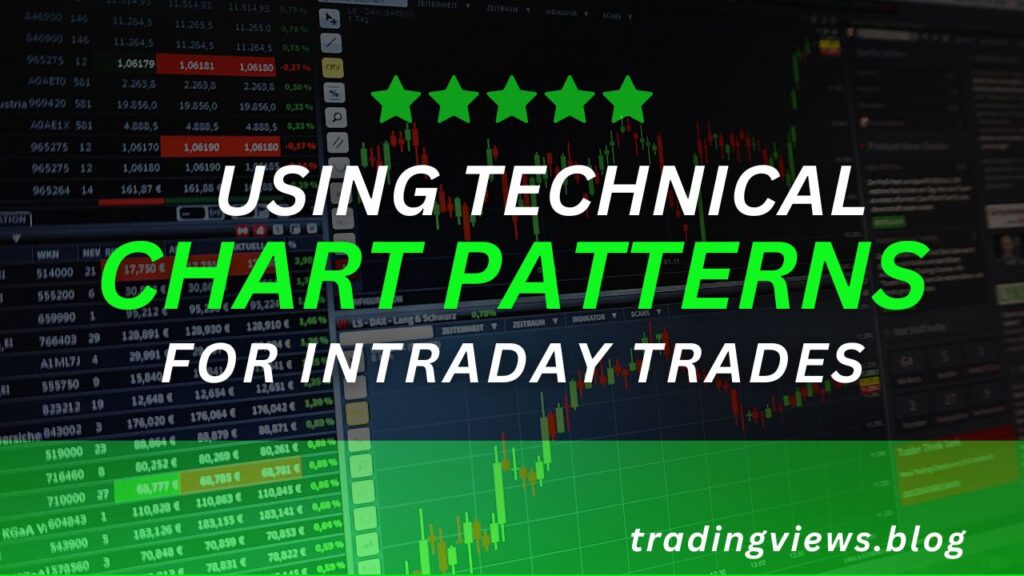
Using Technical Chart Patterns for Intraday Trades – In the wild world of day trading, applying a technical chart pattern strategy can be the key to piling up the wins rather than simply managing frustrating losses. RSI, MACD, and moving averages are great indicators, no doubt, but it’s the chart patterns—the graphical narratives of price action—that most frequently hold the tastiest secrets.
If one is trading with TradingView or something similar, mastering chart patterns is extremely important. These patterns will alert you to the right time to enter trades, assist in determining risk-reward ratios, and actually help amp your game in anticipating the direction the market is taking. In this tutorial, we’ll cover the most effective technical chart patterns used by day traders, how to apply them like a pro, and how the patterns cooperate with nifty tools like TradingView.
Why Are Chart Patterns Important in Day Trading?
Using Technical Chart Patterns for Intraday Trades – Intraday trading is all about executing quick decisions, hitting your entries, and exiting. Chart patterns provide you with a concrete means of reading price action, alerting you to breakouts, reversals, or continuation patterns before they occur.
The greatest advantages of employing chart patterns are:
- Early signal detection: Patterns often form before major moves, giving you a jump on the trade.
- Clear entry/exit zones: Patterns help identify breakout levels, targets, and stop-loss zones.
- Improved trade confidence: Recognizing a known pattern increases conviction in your setup.
- No lag: As opposed to those indicators that examine past data, patterns appear immediately when the price shifts.
So, on platforms like TradingView, you are completely able to annotate your charts, save templates, and even experiment with pattern-based strategies through bar replay or Pine Script.
Best Chart Patterns for Intraday Trading in 2025
1. Bull Flag and Bear Flag
This is a continuation pattern that appears after a large price move (the “flagpole”) and then a rapid cooldown (the “flag”)
- Bull Flag: This appears after a significant price rise and then drops slightly in a downward channel.
- Bear Flag: It reappears after a significant drop, followed by a small upward bump.
How to Trade It?
- Jump in when it breaks out above the flag for a bull flag (or below for a bear flag).
- Set your stop-loss just on the other side of the flag.
- The target’s generally the top of the flagpole.
Why It’s Awesome:
These patterns show a pause in momentum before a continuation, making them ideal for short bursts of volatility common in intraday markets.
2. Double Top & Double Bottom
A reversal pattern that indicates the present trend is losing momentum.
- Double Top: Two peaks roughly the same price indicate there is resistance.
- Double Bottom: Two troughs near the same level suggest support.
How to Trade It?
- Wait until the price breaks the neckline, or in other words, the low between two highs or the highs between two lows.
- On breakouts, use the area between the top and the neckline as your target area.
Use Case:
This is particularly effective during the London or New York session, where there is plenty of trading and additional reversal opportunities arise.
3. Ascending Triangle and Descending Triangle
Continuation patterns with a flat resistance/support line and a rising/falling trendline.
- Ascending Triangle: Higher lows against a flat resistance line.
- Descending Triangle: Lower highs against a flat support level.
How to Trade It?
- Enter as soon as the flat line breaks in earnest.
- Essentially, the objective is simply the triangle’s height and where it breaks out.
- Place a tight stop-loss below the triangle for longs or above it for shorts.
Why Traders Are Interested:
They’re all about stacking up or unloading and tend to ignite major breakouts.
4. Inverse Head and Shoulders / Head and Shoulders
A complete classic reversal pattern.
- Head and Shoulders: This represents a summit in a rising trend.
- Inverse Head and Shoulders: Suggests a bottom in a downtrend.
How to Trade It?
- Connect the two troughs (or peaks) with a line.
- Enter at the break of the neckline.
- Stop-loss below the right shoulder; the target is equal to the gap between the head and the neckline.
Tip
There’s a neat “head and shoulders” pattern tool on TradingView that draws it for you automatically.
5. Ascending and Descending Wedges
Price converges between two sloping lines, often signaling an impending breakout.
- Rising Wedge: Bearish reversal pattern.
- Falling Wedge: Bullish reversal pattern.
How to Trade It?
- Trade the breakout direction with volume confirmation.
- Measure the widest part of the wedge for your price target.
Great for identifying trend exhaustion on the shorter time frames, such as the 5-minute or 15-minute chart.
How to Identify and Confirm Patterns on TradingView
- Use trendlines and horizontal levels: Manually draw support/resistance or connect swing highs/lows.
- Enable those pattern recognition tools: TradingView includes automatic pattern recognition for paying subscribers.
- Volume confirmation check: Big breakouts are often accompanied by a lot of volume.
- Bar Replay Mode: Practice identifying patterns historically using bar replay before going live.
Mixing Chart Patterns and Indicators
Chart Patterns are cool in themselves, but once you couple patterns with clever indicators, you are able to dramatically enhance your accuracy in trading.
- Volume: Confirms breakout strength.
- Moving Averages: Used to confirm trend direction.
- ATR (Average True Range): Helps set realistic stop-loss and take-profit levels.
- MACD/RSI: Provide confirmation for momentum or divergence.
For example, a bull flag pattern breaking out with an RSI above 50 and increasing volume signals strong bullish momentum.
Managing Risk in Pattern-Based Trading
No pattern guarantees success. That’s why proper risk management is key:
- Stop-loss: Put in place a stop slightly behind the pattern edge.
- Risk-to-reward: Aim for a minimum 1:2 ratio.
- Don’t overtrade: Wait for clean, high-probability patterns—avoid over-analyzing cluttered charts.
Look at TradingView’s “Long Position” or “Short Position” tools and gauge your risk and reward before entering into a trade.
Common Mistakes Traders Make with Patterns
- Entering too early: Wait for confirmation, not anticipation.
- Ignoring the market sentiment: A triangle in a choppy sideways market isn’t that reliable.
- Pattern hunting everywhere: Not every market movement forms a tradable pattern.
- Not backtesting: Don’t assume a pattern works—test it with historical data.
- No volume check: Breakouts without volume often fail.
Explore our newest tools designed to enhance your Forex trading experience effortlessly Check HERE
Real Example: Bull Flag on S&P 500 Futures
Okay, so assuming we’re trading the S&P 500 E-mini Futures (ES1!) on the 5-minute chart.
The price rose by 20 points during the first half-hour alone.
- Then consolidates sideways/downward in a tight flag shape.
- Volume drops during the pullback, then spikes as price breaks above the flag.
Trade Setup
- Entry: Breaking through flag resistance
- Wait: Underneath the flag, low
- Objective: Same as flagpole height
This pattern—if timed correctly—could yield a high-reward intraday trade within an hour.
Conclusion: Killing It with Chart Patterns in 2025
Taking control of those technical chart patterns is really beneficial to improve your intraday trading. These visual indicators basically inform you of what the market is doing, and when you identify them early, they provide you with good trade ideas with defined risks.
Greetings! And with platforms like TradingView, it is really easy to catch and enter pattern trades right on the charts. You simply look at flags, wedges, double tops, and triangles—they occur repeatedly across various timeframes and markets, whether in stocks, forex, futures, or crypto.
But remember: success is all about patience, practice, and discipline. Master one pattern at a time, and gradually increase the size. Add good risk control and sound chart-reading skills, and the technical patterns are your advantage in the hectic pace of intraday trading.


Would love to perpetually get updated outstanding blog! .
Thanks for sharing excellent informations. Your web-site is so cool. I’m impressed by the details that you have on this site. It reveals how nicely you understand this subject. Bookmarked this web page, will come back for more articles. You, my friend, ROCK! I found simply the info I already searched everywhere and just could not come across. What an ideal web site.
Woh I love your posts, saved to my bookmarks! .
I really enjoy studying on this site, it contains great posts.
Can I just say what a relief to search out somebody who really knows what theyre speaking about on the internet. You definitely know the way to bring a difficulty to light and make it important. Extra people must read this and perceive this side of the story. I cant believe youre no more fashionable since you positively have the gift.
so much superb information on here, : D.
I conceive this internet site has got very good written content material articles.
naturally like your web site but you have to check the spelling on quite a few of your posts. Several of them are rife with spelling problems and I to find it very bothersome to inform the reality on the other hand I’ll definitely come back again.
I really appreciate this post. I have been looking all over for this! Thank goodness I found it on Bing. You’ve made my day! Thanks again
I have been absent for some time, but now I remember why I used to love this web site. Thank you, I¦ll try and check back more often. How frequently you update your web site?
I always was concerned in this topic and stock still am, thanks for posting.
Wow, amazing blog layout! How long have you been blogging for? you made blogging look easy. The overall look of your website is wonderful, as well as the content!
Great tremendous issues here. I?¦m very glad to look your article. Thank you a lot and i am looking ahead to contact you. Will you please drop me a mail?
Wow, superb blog layout! How long have you been blogging for? you made blogging look easy. The overall look of your web site is excellent, let alone the content!
Thanks for sharing. I read many of your blog posts, cool, your blog is very good.
Thanks for sharing. I read many of your blog posts, cool, your blog is very good.
What i don’t realize is in reality how you’re now not really a lot more smartly-preferred than you might be right now. You’re very intelligent. You realize thus considerably in the case of this subject, produced me personally believe it from a lot of numerous angles. Its like men and women don’t seem to be involved except it’s one thing to accomplish with Woman gaga! Your own stuffs outstanding. At all times deal with it up!